Chernoff face
Human-face shaped display of data
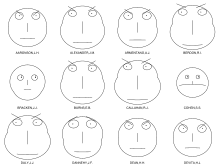
Chernoff faces, invented by applied mathematician, statistician and physicist Herman Chernoff in 1973, display multivariate data in the shape of a human face. The individual parts, such as eyes, ears, mouth and nose represent values of the variables by their shape, size, placement and orientation. The idea behind using faces is that humans easily recognize faces and notice small changes without difficulty. Chernoff faces handle each variable differently. Because the features of the faces vary in perceived importance, the way in which variables are mapped to the features should be carefully chosen (e.g. eye size and eyebrow-slant have been found to carry significant weight).[1]
Detail
Chernoff faces themselves can be plotted on a standard X–Y graph; the faces can be positioned X–Y based on the two most important variables, and then the faces themselves represent the rest of the dimensions for each item. Edward Tufte, presenting such a diagram, says that this kind of Chernoff-face graph would "reduce well, maintaining legibility even with individual areas of 0.05 square inches as shown ... with cartoon faces and even numbers becoming data measures, we would appear to have reached the limit of graphical economy of presentation, imagination, and let it be admitted, eccentricity".[2]
Extensions
Asymmetrical faces
In 1981, Bernhard Flury and Hans Riedwyl suggested "asymmetrical" Chernoff faces; since a face has vertical symmetry (around the y axis), the left side of the face is identical to the right and is basically wasted space – a point also made by Tufte.[3] One could have the 18 variables that specify the left be one set of data, but use a different set of data for the right side of the face, allowing one face to depict 35 different measurements. They present results showing that such asymmetrical faces are useful in visualizing databases of identical twins, for example, and are useful in grouping as pairs of Chernoff faces would be.[citation needed]
Chernoff fish
In Visualizing Financial Data (2016, ISBN 978-1-118-90785-6), Julie Rodriguez and Piotr Kaczmarek use "Chernoff fish", where various parts of a cartoon fish are used to encode different financial details.[4]
In literature
In Peter Watts' novel Blindsight (2006), a transhuman character is seen using a variant of Chernoff faces. This is explained by the character as a more efficient method of representing data, as a large portion of the human brain is devoted to facial recognition. [5]
In the 2014 sci-fi short story "Degrees of Freedom" by Karl Schroeder, Chernoff faces make a prominent appearances as a future technology, supporting the communication of aggregate sentiment and perspective.[6]
References
- ^ "An Experimental Analysis of the Pre-Attentiveness of Features in Chernoff Faces", Morris CJ, Ebert DS, Rheingans P. 1999; published by the conference "Applied Imagery Pattern Recognition: 3D Visualization for Data Exploration and Decision Making". http://www.research.ibm.com/people/c/cjmorris/publications/Chernoff_990402.pdf doi:10.1117/12.384865
- ^ Edward R. Tufte, The Visual Display of Quantitative Information, p. 142.
- ^ Edward R. Tufte, The Visual Display of Quantitative Information, p. 97: "Halves may be easier to sort (by matching the right half of an unsorted face to the left half of a sorted face) than full faces. Or else an asymmetrical full face can be used to report additional variables (Flury & Riedwyl 1981). Bilateral symmetry doubles the space consumed by the design in a graph, without adding new information."
- ^ Visualizing Financial Data. John Wiley & Sons. 2 May 2016. ISBN 9781118907856.
- ^ Peter Watts. "Blindsight". Retrieved 2021-04-19.
- ^ Karl Schroeder. "End notes from Karl Schroeder's "Degrees of Freedom"". Archived from the original on 2018-03-24. Retrieved 2018-03-23.
Other sources
- Herman Chernoff (1973). "The Use of Faces to Represent Points in K-Dimensional Space Graphically" (PDF). Journal of the American Statistical Association. 68 (342). American Statistical Association: 361–368. doi:10.2307/2284077. JSTOR 2284077. Archived from the original (PDF) on 2012-04-15.
- Bernhard Flury and Hans Riedwyl (December 1981). "Graphical Representation of Multivariate Data by Means of Asymmetrical Faces" (PDF). Journal of the American Statistical Association. 76 (376). American Statistical Association: 757–765. doi:10.2307/2287565. JSTOR 2287565.[permanent dead link]
Further reading
- "Facial Representation of Multivariate Data", David L. Huff, Vijay Mahajan and William C. Black. Journal of Marketing, Vol. 45, No. 4 (Autumn, 1981), pp. 53–59.Published by: American Marketing Association
- "FACES-A FORTRAN Program for Generating Chernoff-Type Faces on a Line Printer"[permanent dead link], Danny W. Turner and F. Eugene Tidmore. The American Statistician, Vol. 34, No. 3 (Aug., 1980), p. 187 Published by: American Statistical Association
- "Representing Points in Many Dimensions by Trees and Castles"[permanent dead link], B. Kleiner and J. A. Hartigan. Journal of the American Statistical Association, Vol. 76, No. 374 (Jun., 1981), pp. 260–269. Published by the American Statistical Association
- Gonick, L. and Smith, W. The Cartoon Guide to Statistics. New York: Harper Perennial, p. 212, 1993.
- Moriarity, S. (1979). "Communicating financial information through multidimensional graphics". Journal of Accounting Research 17, 205-224.
- Stock, D. and Watson, C. (1984). "Human judgment accuracy, multidimensional graphics, and humans versus models". Journal of Accounting Research 22, 192-206.
- Information Visualization: Perception for Design (2004), Ware C.
- "The Empathic Visualisation Algorithm: Chernoff Faces Revisited" (218)[1]
- "An empirical evaluation of Chernoff faces, star glyphs, and spatial visualizations for binary data", Michael D. Lee, Rachel E. Reilly, Marcus E. Butavicius. ACM International Conference Proceeding Series; Vol. 142, Proceedings of the Asia-Pacific symposium on Information visualisation - Volume 24
- "Graphical representation of multivariate data using Chernoff faces", Raciborski 2009, The Stata Journal 9, Number 3, pp. 374–387
- Jan Fazlagić, Windham Loopesko, Leszek Matuszak, Rigby Johnson. Perspectives and good practices in visualization of knowledge about public entities // Information Visualization Techniques in the Social Sciences and Humanities / Grzegorz Osinski, Veslava Osińska. — IGI Global, 2018. — P. 199−214. — ISBN 9781522549918.
External links
- "Professor Puts a Face on the Performance of Baseball Managers" -(The New York Times; Chernoff faces generated from manager performance data)
- "A Critique of Chernoff Faces" Archived 2011-12-21 at the Wayback Machine - Robert Kosara, published February 25, 2007
- Java visualization
- Example of urban living conditions in LA
- Example and code for the R statistical software environment
- Example and code for Python using the matplotlib library
- ChernoffFace package in Python using the matplotlib library
- Function ChernoffFace in Wolfram Language (Mathematica) at Wolfram Function Repository
- Example code for MATLAB using Statistics and Machine Learning Toolbox.
- "Mapping Quality of Life with Chernoff Faces", Joseph G. Spinelli and Yu Zhou
- "SUGI 26: Escaping Flatland: Chernoff's Faces Revisited" -(modifying FACES for more aesthetic output)
- "Faces 2.0" Archived 2008-09-27 at the Wayback Machine -(a Mac OS X screensaver which generates random Chernoff faces)
- NovoSpark Visualizer - an advanced visualization tool that enables qualitative analysis of multidimensional data through the exploration of a graphical image.
- "How to visualize data with cartoonish faces ala Chernoff" (Flowing Data)
- Baseball faces - at the Institute for Quantitative Social Science at Harvard University


