Bom Jesus, Rio Grande do Sul
Municipality in Rio Grande do Sul, Brazil

Flag
BJ

(2020[2])
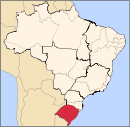
Bom Jesus is a municipality in the state of Rio Grande do Sul, Brazil. Its population was approximately 11,309 in 2020.
The city is one of the coldest in Brazil, and snowfall is not uncommon.
Climate
| Climate data for Bom Jesus, Rio Grande do Sul, 1981-2010 normals, extremes 1961-2010 | |||||||||||||
|---|---|---|---|---|---|---|---|---|---|---|---|---|---|
| Month | Jan | Feb | Mar | Apr | May | Jun | Jul | Aug | Sep | Oct | Nov | Dec | Year |
| Record high °C (°F) | 33.0 (91.4) | 31.6 (88.9) | 32.5 (90.5) | 29.8 (85.6) | 26.3 (79.3) | 25.4 (77.7) | 25.0 (77.0) | 29.6 (85.3) | 31.1 (88.0) | 31.0 (87.8) | 31.4 (88.5) | 32.0 (89.6) | 33.0 (91.4) |
| Mean daily maximum °C (°F) | 25.2 (77.4) | 25.1 (77.2) | 24.2 (75.6) | 21.5 (70.7) | 18.2 (64.8) | 16.9 (62.4) | 16.7 (62.1) | 18.6 (65.5) | 19.1 (66.4) | 21.2 (70.2) | 23.0 (73.4) | 24.9 (76.8) | 21.2 (70.2) |
| Daily mean °C (°F) | 19.0 (66.2) | 18.9 (66.0) | 17.9 (64.2) | 15.3 (59.5) | 12.0 (53.6) | 10.9 (51.6) | 10.2 (50.4) | 11.7 (53.1) | 12.5 (54.5) | 15.0 (59.0) | 16.5 (61.7) | 18.2 (64.8) | 14.8 (58.7) |
| Mean daily minimum °C (°F) | 14.5 (58.1) | 14.5 (58.1) | 13.6 (56.5) | 11.0 (51.8) | 7.9 (46.2) | 6.5 (43.7) | 5.6 (42.1) | 6.8 (44.2) | 7.8 (46.0) | 10.4 (50.7) | 11.6 (52.9) | 13.4 (56.1) | 10.3 (50.5) |
| Record low °C (°F) | 5.5 (41.9) | 5.0 (41.0) | 2.6 (36.7) | 0.0 (32.0) | −4.2 (24.4) | −6.2 (20.8) | −7.2 (19.0) | −8.0 (17.6) | −4.2 (24.4) | −1.0 (30.2) | 1.0 (33.8) | 2.2 (36.0) | −8.0 (17.6) |
| Average precipitation mm (inches) | 168.7 (6.64) | 167.1 (6.58) | 107.7 (4.24) | 112.2 (4.42) | 111.9 (4.41) | 123.8 (4.87) | 171.9 (6.77) | 132.1 (5.20) | 156.7 (6.17) | 165.1 (6.50) | 139.9 (5.51) | 147.8 (5.82) | 1,704.9 (67.13) |
| Average precipitation days (≥ 1 mm) | 13 | 13 | 12 | 9 | 8 | 9 | 10 | 9 | 10 | 12 | 11 | 12 | 128 |
| Average relative humidity (%) | 80.3 | 81.5 | 81.3 | 81.5 | 82.7 | 82.0 | 80.0 | 74.6 | 77.7 | 79.3 | 77.5 | 78.0 | 79.7 |
| Mean monthly sunshine hours | 188.9 | 163.7 | 186.6 | 161.1 | 145.0 | 114.0 | 140.0 | 155.0 | 148.8 | 162.9 | 194.1 | 194.5 | 1,954.6 |
| Percent possible sunshine | 45 | 45 | 49 | 48 | 44 | 37 | 44 | 45 | 42 | 41 | 48 | 45 | 45 |
| Source: INMET[5] | |||||||||||||
References
- ^ a b "Divisão Territorial do Brasil". Divisão Territorial do Brasil e Limites Territoriais. Instituto Brasileiro de Geografia e Estatística (IBGE). 1 July 2008. Archived from the original on June 14, 2020. Retrieved 11 October 2008.
- ^ IBGE 2020
- ^ "Ranking decrescente do IDH-M dos municípios do Brasil". Atlas do Desenvolvimento Humano. Programa das Nações Unidas para o Desenvolvimento (PNUD). 2000. Archived from the original on 3 October 2009. Retrieved 11 October 2008.
- ^ "Produto Interno Bruto dos Municípios 2002-2005" (PDF). Instituto Brasileiro de Geografia e Estatística (IBGE). 19 December 2007. Archived from the original (PDF) on 2 October 2008. Retrieved 11 October 2008.
- ^ "Normais Climatológicas do Brasil". National Institute of Meteorology. Retrieved July 20, 2021.
- v
- t
- e

Capital: Porto Alegre
Mesoregion Centro Ocidental Rio-Grandense | |||||||
|---|---|---|---|---|---|---|---|
| |||||||
Mesoregion Metropolitana de Porto Alegre | |||||||||||||
|---|---|---|---|---|---|---|---|---|---|---|---|---|---|
| |||||||||||||
Mesoregion Nordeste Rio-Grandense | |||||||
|---|---|---|---|---|---|---|---|
| |||||||
Mesoregion Noroeste Rio-Grandense | |||||||||||||||||||||||||||
|---|---|---|---|---|---|---|---|---|---|---|---|---|---|---|---|---|---|---|---|---|---|---|---|---|---|---|---|
| |||||||||||||||||||||||||||
Mesoregion Sudeste Rio-Grandense | |||||||||
|---|---|---|---|---|---|---|---|---|---|
| |||||||||
Mesoregion Sudoeste Rio-Grandense | |||||||
|---|---|---|---|---|---|---|---|
| |||||||
Authority control databases | |
|---|---|
| International |
|
| National |
|
28°40′4″S 50°25′1″W / 28.66778°S 50.41694°W / -28.66778; -50.41694
 | This geographical article relating to Rio Grande do Sul is a stub. You can help Wikipedia by expanding it. |
- v
- t
- e


