Part of the 2009 Irish local elections
2009 Kilkenny County Council election
|
|
All 26 seats on Kilkenny County Council |
|---|
| | First party | Second party | Third party | | | | | | | Party | Fine Gael | Fianna Fáil | Labour | | Seats won | 12 | 7 | 5 | | Seat change | +1 | -1 | - |
| | | Fourth party | Fifth party | | | | | | Party | Green | Independent | | Seats won | 1 | 1 | | Seat change | - | - | |
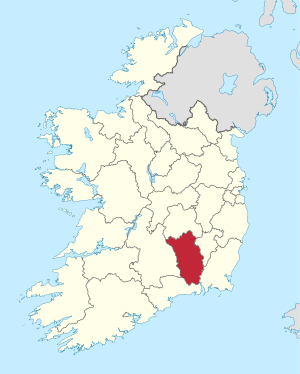 Map showing the area of Kilkenny County Council |
Council control before election
Fine Gael
Labour Party
| Council control after election
Fine Gael
Labour Party
| |
An election to Kilkenny County Council took place on 5 June 2009 as part of that year's Irish local elections. 26 councillors were elected from five local electoral areas (LEAs) for a five-year term of office on the electoral system of proportional representation by means of the single transferable vote (PR-STV).
Results by party
| Party | Seats | ± | First Pref. votes | FPv% | ±% |
| | Fine Gael | 12 | +1 | | | |
| | Fianna Fáil | 7 | -1 | | | |
| | Labour | 5 | - | | | |
| | Green | 1 | - | | | |
| | Independent | 1 | - | | | |
| Totals | 26 | - | | 100.0 | — |
Results by local electoral area
Ballyragget
Ballyragget - 5 seats | Party | Candidate | FPv% | Count |
| 1 | 2 | 3 | 4 | 5 | 6 |
| | Labour | Maurice Shortall* | 22.99 | 2,004 | | | | | |
| | Fine Gael | Mary Hilda Cavanagh* | 20.93 | 1,824 | | | | | |
| | Fianna Fáil | Pat Millea* | 14.55 | 1,268 | 1,295 | 1,391 | 1,427 | 1,501 | |
| | Fine Gael | Catherine Connery* | 10.96 | 955 | 1,021 | 1,129 | 1,168 | 1,202 | 1,259 |
| | Fine Gael | Dan Brennan* | 9.82 | 856 | 1,036 | 1,098 | 1,199 | 1,252 | 1,467 |
| | Independent | Martin Carroll | 6.90 | 601 | 717 | 733 | 837 | 921 | 1,111 |
| | Fianna Fáil | Brid Mooney-Doyle | 6.67 | 581 | 627 | 642 | 680 | 718 | |
| | Independent | Gerard Ferris | 3.63 | 316 | 390 | 405 | | | |
| | Sinn Féin | Ray Quinlan | 3.57 | 311 | 353 | 412 | 437 | | |
| Electorate: 13,162 Valid: 8,716 (66.22%) Spoilt: 154 Quota: 1,453 Turnout: 8,870 (67.39%) |
Callan
Callan - 4 seats | Party | Candidate | FPv% | Count |
| 1 | 2 | 3 |
| | Fine Gael | Billy Ireland* | 19.19 | 1,269 | 1,364 | |
| | Fianna Fáil | Matt Doran* | 18.22 | 1,205 | 1,233 | 1,266 |
| | Independent | Patrick Crowley | 17.89 | 1,183 | 1,277 | 1,461 |
| | Fine Gael | Tom Maher* | 17.39 | 1,150 | 1,181 | 1,367 |
| | Fianna Fáil | Joe Brennan | 13.62 | 901 | 967 | 1,007 |
| | Labour | Brian Harris | 7.74 | 512 | 558 | |
| | Independent | John Eardly | 5.96 | 394 | | |
| Electorate: 10,435 Valid: 6,614 (63.38%) Spoilt: 92 Quota: 1,323 Turnout: 6,706 (64.26%) |
Kilkenny
Kilkenny - 7 seats | Party | Candidate | FPv% | Count |
| 1 | 2 | 3 | 4 | 5 | 6 | 7 | 8 | 9 |
| | Fianna Fáil | Andrew McGuinness | 17.58 | 1,880 | | | | | | | | |
| | Fine Gael | Martin Brett* | 11.24 | 1,202 | 1,231 | 1,258 | 1,279 | 1,334 | 1,418 | | | |
| | Green | Malcolm Noonan* | 10.29 | 1,100 | 1,134 | 1,154 | 1,214 | 1,303 | 1,444 | | | |
| | Fine Gael | Betty Manning | 9.16 | 979 | 1,002 | 1,020 | 1,047 | 1,092 | 1,154 | 1,189 | 1,200 | 1,290 |
| | Fianna Fáil | John Coonan* | 9.14 | 977 | 1,071 | 1,090 | 1,111 | 1,153 | 1,191 | 1,201 | 1,214 | 1,295 |
| | Fine Gael | Paul Cuddihy* | 8.76 | 937 | 951 | 978 | 995 | 1,027 | 1,069 | 1,086 | 1,108 | 1,186 |
| | Labour | Marie Fitzpatrick* | 6.55 | 700 | 730 | 837 | 854 | 899 | 1,088 | 1,112 | 1,126 | 1,346 |
| | Sinn Féin | Kathleen Funchion | 6.24 | 667 | 698 | 718 | 766 | 818 | 856 | 870 | 876 | |
| | Fianna Fáil | Pat Fitzpatrick* | 5.90 | 631 | 851 | 860 | 878 | 897 | 921 | 928 | 929 | 983 |
| | Labour | Seán O hArgain | 5.16 | 552 | 567 | 620 | 643 | 700 | | | | |
| | Independent | Frank Kavanagh | 4.14 | 443 | 456 | 466 | 513 | | | | | |
| | Labour | Seán Butler | 3.01 | 322 | 331 | | | | | | | |
| | Independent | Eugene McGuinness | 2.82 | 302 | 333 | 339 | | | | | | |
| Electorate: 17,724 Valid: 10,692 (60.32%) Spoilt: 169 Quota: 1,337 Turnout: 10,861 (61.28%) |
Piltown
Piltown - 6 seats | Party | Candidate | FPv% | Count |
| 1 | 2 | 3 | 4 | 5 | 6 | 7 | 8 | 9 | 10 |
| | Labour | Tomás Breathnach* | 15.98 | 1,653 | | | | | | | | | |
| | Fine Gael | Pat Dunphy* | 15.17 | 1,570 | | | | | | | | | |
| | Fianna Fáil | Eamon Aylward | 11.00 | 1,138 | 1,151 | 1,156 | 1,256 | 1,295 | 1,325 | 1,329 | 1,417 | 1,664 | |
| | Fine Gael | Anne Maria Irish | 10.61 | 1,098 | 1,137 | 1,157 | 1,174 | 1,234 | 1,550 | | | | |
| | Fine Gael | Fidelis Doherty | 9.85 | 1,019 | 1,039 | 1,052 | 1,065 | 1,087 | 1,209 | 1,240 | 1,352 | 1,461 | 1,493 |
| | Fine Gael | Paddy Gaule | 7.25 | 750 | 760 | 772 | 779 | 798 | 835 | 856 | 908 | 1,054 | 1,079 |
| | Fianna Fáil | Pat Walsh* | 6.44 | 666 | 669 | 670 | 692 | 706 | 730 | 734 | 756 | | |
| | Fine Gael | Fintan Byrne | 5.91 | 611 | 627 | 633 | 639 | 675 | | | | | |
| | Fianna Fáil | Cora Long* | 5.54 | 573 | 593 | 607 | 703 | 732 | 753 | 759 | 930 | 1,076 | 1,201 |
| | Independent | Ann Blackmore | 4.52 | 468 | 491 | 499 | 604 | 693 | 716 | 721 | | | |
| | Fianna Fáil | Robert Duggan | 3.93 | 407 | 412 | 418 | | | | | | | |
| | Sinn Féin | Peadar de Bluit | 3.81 | 394 | 419 | 425 | 437 | | | | | | |
| Electorate: 16,342 Valid: 10,347 (63.32%) Spoilt: 111 Quota: 1,479 Turnout: 10,458 (63.99%) |
Thomastown
Thomastown - 4 seats | Party | Candidate | FPv% | Count |
| 1 | 2 | 3 | 4 | 5 | 6 | 7 | 8 |
| | Fine Gael | Pat O'Neill* | 19.24 | 1,459 | 1,504 | 1,534 | | | | | |
| | Labour | Ann Phelan* | 15.60 | 1,183 | 1,296 | 1,454 | 1,508 | 1,514 | 1,574 | | |
| | Labour | Michael O'Brien* | 11.13 | 844 | 892 | 925 | 1,021 | 1,023 | 1,082 | 1,276 | 1,289 |
| | Independent | Dixie Doyle* | 10.47 | 794 | 882 | 887 | 972 | 972 | 1,076 | 1,234 | 1,242 |
| | Fianna Fáil | Tom Brennan* | 8.87 | 673 | 687 | 730 | 745 | 747 | | | |
| | Fianna Fáil | Seán Treacy | 8.47 | 642 | 678 | 725 | 793 | 794 | 1,141 | 1,242 | 1,257 |
| | Fine Gael | Willie Barron | 7.71 | 585 | 615 | 687 | 873 | 879 | 922 | | |
| | Fine Gael | Joey O'Hanrahan | 6.82 | 517 | 536 | 548 | | | | | |
| | Independent | Joan Murphy | 6.16 | 467 | 516 | | | | | | |
| | Green | Duncan Russell | 3.11 | 236 | | | | | | | |
| | Sinn Féin | Jamie Roche | 2.43 | 184 | | | | | | | |
| Electorate: 11,284 Valid: 7,584 (67.21%) Spoilt: 103 Quota: 1,517 Turnout: 7,687 (68.12%) |
External links


