2008 UK local government election
2008 Basingstoke and Deane Borough Council election
|
|
all 60 seats to Basingstoke and Deane Borough Council
31 seats needed for a majority |
|---|
| Turnout | 37% |
|---|
| | First party | Second party | | | | | | Party | Conservative | Liberal Democrats | | Seats won | 35 | 14 | | Seat change | +5 | -2 | | Popular vote | 51,638 | 23,403 | | Percentage | 56.8 | 25.7 |
| | | Third party | Fourth party | | | | | | Party | Labour | Independent | | Seats won | 9 | 14 | | Seat change | -2 | -1 | | Popular vote | 13,770 | 2,037 | | Percentage | 15.1 | 2.2 | |
 |
Council control before election
Conservative Party (UK)
| Council control after election
Conservative Party (UK)
| |
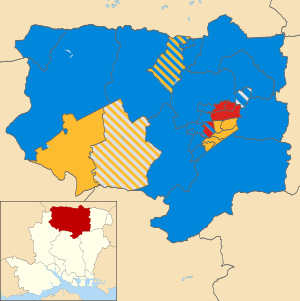
The 2008 Basingstoke and Deane Council election took place on 1 May 2008 to elect members of Basingstoke and Deane Borough Council in Hampshire, England. The whole council was up for election with boundary changes since the 2007 election.[1] The Conservative Party gained overall control of the council from no overall control.[2]
Background
After the last election in 2007 the Conservatives had a majority on the council with 31 of the 60 seats.[3] However the Conservatives would lose their majority after defeat by the Liberal Democrats in a by-election in Baughurst in January 2008 left the Conservatives with exactly half o the seats.[4]
The whole council was contested in 2008 instead of the usual third, after changes were made to the boundaries.[5] The changes included abolishing Calleva ward and creating a Bramley and Sherfield ward.[5] Tadley North was split in two, Burghclere was merged with Highclere and St Mary Bourne and the number of seats in Winklebury ward was reduced by one.[5][6]
Councillors standing down at the election included Gwen Richardson and Erica Shaw, while former Labour group leader David Potter and the former Conservative council leader from the 1980s and 1990s, Stephen Reid, attempted to return to the council.[6] Meanwhile, Independent councillor David Leeks, stood for the Conservatives after joining the party.[6]
Election result
The results saw the Conservatives gain a 10-seat majority on the council after winning 35 of the 60 seats.[7] This was compared to 14 Liberal Democrat, 9 Labour and 2 independent councillors.[2] Among those defeated in the election was the leader of the Labour group on the council, Gary Watts, who lost in South Ham[2] and the mayor Warwick Lovegrove.[7] The former leader of the council Stephen Reid returned to the council in Buckskin, defeating a former mayor Tony Jones.[7] Overall turnout in the election was 37%.[8]
Following the election Conservative Andrew Finney became the new leader of the council succeeding John Leek.[9][10]
Basingstoke and Deane Local Election Result 2008[8] | Party | Seats | Gains | Losses | Net gain/loss | Seats % | Votes % | Votes | +/− |
| | Conservative | 35 | | | +5 | 58.3 | 56.8 | 51,638 | +2.4% |
| | Liberal Democrats | 14 | | | -2 | 23.3 | 25.7 | 23,403 | +2.1% |
| | Labour | 9 | | | -2 | 15.0 | 15.1 | 13,770 | -3.3% |
| | Independent | 2 | | | -1 | 3.3 | 2.2 | 2,037 | -1.5% |
| | Green | 0 | | | 0 | 0 | 0.1 | 86 | +0.1% |
Ward results
Basing (3)[8] | Party | Candidate | Votes | % | ±% |
| | Conservative | Sven Godesen | 1,962 | | |
| | Conservative | Stephen Marks | 1,821 | | |
| | Conservative | Onnalee Cubitt | 1,725 | | |
| | Liberal Democrats | Alan Read | 1,161 | | |
| | Liberal Democrats | Patricia Read | 1,042 | | |
| | Liberal Democrats | Anna Archibald | 928 | | |
| | Labour | Julie Johnson | 149 | | |
| Turnout | 8,788 | 49 | |
Baughurst and Tadley North (2)[8] | Party | Candidate | Votes | % | ±% |
| | Liberal Democrats | Michael Bound | 953 | | |
| | Conservative | Graham Round | 887 | | |
| | Liberal Democrats | Warwick Lovegrove | 864 | | |
| | Labour | David Carr | 126 | | |
| Turnout | 2,830 | 41 | |
Bramley and Sherfield (2)[8] | Party | Candidate | Votes | % | ±% |
| | Conservative | Rhydian Vaughan | 1,091 | | |
| | Conservative | Ranil Jayawardena | 1,063 | | |
| | Liberal Democrats | Elaine Cameron | 230 | | |
| | Liberal Democrats | Janice Spalding | 189 | | |
| | Labour | Faye Jones | 113 | | |
| Turnout | 2,686 | 39 | |
Brighton Hill North (2)[8] | Party | Candidate | Votes | % | ±% |
| | Liberal Democrats | Sheila Rowland | 689 | | |
| | Liberal Democrats | Brian Gurden | 675 | | |
| | Conservative | Roy Hall-Lacy | 285 | | |
| | Conservative | Zoe Wheddon | 259 | | |
| | Labour | Criss Connor | 117 | | |
| | Labour | Colin Regan | 116 | | |
| Turnout | 2,141 | 29 | |
Brighton Hill South (2)[8] | Party | Candidate | Votes | % | ±% |
| | Liberal Democrats | Kevin Harkess | 578 | | |
| | Liberal Democrats | John Barnes | 524 | | |
| | Conservative | John Holley | 390 | | |
| | Conservative | Matt Wheddon | 362 | | |
| | Labour | Elizabeth Regan | 187 | | |
| | Labour | Steve Rothman | 143 | | |
| Turnout | 2,184 | 29 | |
Brookvale and Kings Furlong (2)[8] | Party | Candidate | Votes | % | ±% |
| | Liberal Democrats | Doris Jones | 834 | | |
| | Liberal Democrats | John Shaw | 818 | | |
| | Conservative | Darcy Jones | 306 | | |
| | Conservative | John Loveys Jervoise | 267 | | |
| | Labour | Pauline Courtenay | 142 | | |
| | Labour | Philip Courtenay | 130 | | |
| Turnout | 2,497 | 31 | |
Buckskin (2)[8] | Party | Candidate | Votes | % | ±% |
| | Conservative | Stephen Reid | 680 | | |
| | Conservative | Robert Taylor | 678 | | |
| | Labour | Tony Jones | 437 | | |
| | Labour | Gill Gleeson | 429 | | |
| | Liberal Democrats | Eric Jones | 152 | | |
| Turnout | 2,376 | 33 | |
Burghclere, Highclere and St Mary Bourne (2)[8] | Party | Candidate | Votes | % | ±% |
| | Conservative | James Lewin | 1,452 | | |
| | Conservative | Horace Mitchell | 1,370 | | |
| | Liberal Democrats | Pauleen Malone | 295 | | |
| | Liberal Democrats | Anthony Davies | 285 | | |
| | Labour | Romilla Arber | 115 | | |
| Turnout | 3,517 | 44 | |
Chineham (3)[8] | Party | Candidate | Votes | % | ±% |
| | Conservative | Elaine Still | 1,212 | | |
| | Independent | Martin Biermann | 1,129 | | |
| | Conservative | John Downes | 1,013 | | |
| | Conservative | Hayley Eachus | 878 | | |
| | Liberal Democrats | Liam Elvish | 271 | | |
| | Liberal Democrats | Sheena Grassi | 170 | | |
| | Labour | Eddie Davey | 151 | | |
| Turnout | 4,824 | 33 | |
East Woodhay[8] | Party | Candidate | Votes | % | ±% |
| | Conservative | Clive Sanders | 770 | 85.7 | |
| | Liberal Democrats | Lucy Sloane Williams | 128 | 14.3 | |
| Majority | 642 | 71.4 | |
| Turnout | 898 | 41 | |
Eastrop (2)[8] | Party | Candidate | Votes | % | ±% |
| | Liberal Democrats | Stuart Parker | 660 | | |
| | Liberal Democrats | Gavin James | 542 | | |
| | Conservative | Ronald Collins | 280 | | |
| | Conservative | Rebecca Downes | 271 | | |
| | Labour | Phil Howe | 128 | | |
| | Labour | Eileen Cavanagh | 122 | | |
| | Green | Matthew Pinto | 86 | | |
| Turnout | 2,089 | 32 | |
Grove (2)[8] | Party | Candidate | Votes | % | ±% |
| | Liberal Democrats | Ronald Hussey | 1,187 | | |
| | Liberal Democrats | Stephen Day | 1,045 | | |
| | Conservative | Stephen McConnell | 602 | | |
| | Conservative | Nalin Jayawardena | 546 | | |
| | Labour | Hema Krishan | 90 | | |
| | Labour | David Potter | 80 | | |
| Turnout | 3,550 | 42 | |
Hatch Warren and Beggarwood (3)[8] | Party | Candidate | Votes | % | ±% |
| | Conservative | Dan Putty | 1,291 | | |
| | Conservative | Philip Heath | 1,254 | | |
| | Conservative | Harold Robinson | 1,245 | | |
| | Liberal Democrats | Ruth Day | 354 | | |
| | Liberal Democrats | Josephine Amesbury | 237 | | |
| | Liberal Democrats | Thomas Mitchell | 235 | | |
| | Labour | Dawn Watts | 189 | | |
| | Labour | Mike Stockwell | 123 | | |
| | Labour | Upali Wickremeratne | 113 | | |
| Turnout | 5,041 | 28 | |
Kempshott (3)[8] | Party | Candidate | Votes | % | ±% |
| | Conservative | Anne Court | 1,683 | | |
| | Conservative | Rita Burgess | 1,586 | | |
| | Conservative | Christine Heath | 1,560 | | |
| | Labour | Richard Davey | 278 | | |
| | Liberal Democrats | Eleanor Gurden | 273 | | |
| | Liberal Democrats | Sheila Lock | 257 | | |
| | Liberal Democrats | Alan Simpson | 253 | | |
| | Labour | Walter McCormick | 251 | | |
| | Labour | Nigel Wooldridge | 197 | | |
| Turnout | 6,338 | 39 | |
Kingsclere (2)[8] | Party | Candidate | Votes | % | ±% |
| | Conservative | Cathy Osselton | 1,288 | | |
| | Conservative | Ken Rhatigan | 1,134 | | |
| | Liberal Democrats | Roger Ward | 206 | | |
| | Labour | Jim Gibb | 186 | | |
| | Liberal Democrats | Jean Watts | 153 | | |
| Turnout | 2,967 | 41 | |
Norden (3)[8] | Party | Candidate | Votes | % | ±% |
| | Labour | Paul Harvey | 1,005 | | |
| | Labour | George Hood | 997 | | |
| | Labour | Laura James | 990 | | |
| | Conservative | Keith Brant | 548 | | |
| | Conservative | Jim Holder | 522 | | |
| | Conservative | Nigel McNair Scott | 510 | | |
| | Liberal Democrats | Janet Renwick | 244 | | |
| | Liberal Democrats | Jade Doswell | 225 | | |
| | Liberal Democrats | Alistair Archibald | 213 | | |
| Turnout | 5,254 | 30 | |
Oakley and North Waltham (3)[8] | Party | Candidate | Votes | % | ±% |
| | Conservative | Diane Taylor | 1,299 | | |
| | Conservative | Cecilia Morrison | 1,284 | | |
| | Conservative | Andrew Finney | 1,119 | | |
| | Liberal Democrats | John Burbidge-King | 366 | | |
| | Liberal Democrats | Robert Cooper | 241 | | |
| | Liberal Democrats | Caroline Statham | 203 | | |
| | Labour | David Cavanagh | 88 | | |
| | Labour | Roger Bailey | 80 | | |
| Turnout | 4,680 | 45 | |
Overton, Laverstoke and Steventon (2)[8] | Party | Candidate | Votes | % | ±% |
| | Liberal Democrats | Paula Baker | 924 | | |
| | Independent | Ian Tilbury | 908 | | |
| | Conservative | Marion Jones | 442 | | |
| | Conservative | Clare Coffey | 398 | | |
| | Liberal Democrats | Jacky Lessware | 301 | | |
| | Labour | Rick Dady | 98 | | |
| Turnout | 3,071 | 46 | |
Pamber and Silchester (2)[8] | Party | Candidate | Votes | % | ±% |
| | Conservative | Keith Chapman | 1,285 | | |
| | Conservative | Marilyn Tucker | 1,091 | | |
| | Liberal Democrats | Marina Barnett | 339 | | |
| | Labour | Terry Price | 206 | | |
| Turnout | 2,921 | 44 | |
Popley East (2)[8] | Party | Candidate | Votes | % | ±% |
| | Labour | Mary Brian | 546 | | |
| | Labour | Andy McCormick | 535 | | |
| | Conservative | Hugo Cubitt | 254 | | |
| | Conservative | Gordon Pirie | 217 | | |
| | Liberal Democrats | Cynthia Oliver | 120 | | |
| | Liberal Democrats | Stephen Whitechurch | 110 | | |
| Turnout | 1,782 | 26 | |
Popley West (2)[8] | Party | Candidate | Votes | % | ±% |
| | Labour | Jane Frankum | 386 | | |
| | Labour | Paul Frankum | 345 | | |
| | Conservative | Paul Miller | 250 | | |
| | Conservative | Christopher Aldous | 232 | | |
| | Liberal Democrats | Peter Harris | 81 | | |
| | Liberal Democrats | Roger Barnard | 75 | | |
| Turnout | 1,369 | 28 | |
Rooksdown[8] | Party | Candidate | Votes | % | ±% |
| | Conservative | Karen Cherrett | 261 | 65.6 | |
| | Liberal Democrats | Michael Berwick-Gooding | 114 | 28.6 | |
| | Labour | Stan Parry | 23 | 5.8 | |
| Majority | 147 | 37.0 | |
| Turnout | 398 | 37 | |
Sherborne St John[8] | Party | Candidate | Votes | % | ±% |
| | Conservative | John Leek | 652 | 79.1 | |
| | Liberal Democrats | John Wall | 114 | 13.8 | |
| | Labour | Tony Frankum | 58 | 7.0 | |
| Majority | 538 | 65.3 | |
| Turnout | 824 | 47 | |
South Ham (3)[8] | Party | Candidate | Votes | % | ±% |
| | Labour | Gerry Traynor | 1,056 | | |
| | Conservative | Richard Court | 1,023 | | |
| | Labour | Sean Keating | 941 | | |
| | Conservative | Lee Jones | 913 | | |
| | Conservative | Roger Gardiner | 911 | | |
| | Labour | Gary Watts | 869 | | |
| | Liberal Democrats | Kevin Oxlade | 318 | | |
| | Liberal Democrats | Madeline Hussey | 249 | | |
| | Liberal Democrats | Benjamin Heley | 225 | | |
| Turnout | 6,505 | 35 | |
Tadley Central[8] | Party | Candidate | Votes | % | ±% |
| | Conservative | Stephen West | 529 | 54.3 | |
| | Liberal Democrats | Jo Slimin | 414 | 42.5 | |
| | Labour | Ray Curry | 31 | 3.2 | |
| Majority | 115 | 11.8 | |
| Turnout | 974 | 46 | |
Tadley South (2)[8] | Party | Candidate | Votes | % | ±% |
| | Conservative | David Leeks | 1,048 | | |
| | Conservative | Rob Musson | 928 | | |
| | Liberal Democrats | Ian Hankinson | 371 | | |
| | Labour | Susan Dady | 167 | | |
| Turnout | 2,514 | 32 | |
Upton Grey and The Candovers[8] | Party | Candidate | Votes | % | ±% |
| | Conservative | Mark Ruffell | 919 | 91.5 | |
| | Labour | Ronald Rowe | 85 | 8.5 | |
| Majority | 834 | 83.0 | |
| Turnout | 1,004 | 47 | |
Whitchurch (2)[8] | Party | Candidate | Votes | % | ±% |
| | Liberal Democrats | Eric Dunlop | 922 | | |
| | Liberal Democrats | Keith Watts | 862 | | |
| | Conservative | Bill Judge | 846 | | |
| | Conservative | Therese Coffey | 779 | | |
| Turnout | 3,409 | 46 | |
Winklebury (2)[8] | Party | Candidate | Votes | % | ±% |
| | Conservative | Rob Golding | 1,097 | | |
| | Conservative | Robert Donnell | 1,070 | | |
| | Labour | Angie Freeman | 580 | | |
| | Labour | Lea Jeff | 572 | | |
| | Liberal Democrats | Richard Whitechurch | 97 | | |
| | Liberal Democrats | Obi Nwasike | 87 | | |
| Turnout | 3,503 | 39 | |
References
- ^ "Basingstoke & Deane". BBC News Online. Retrieved 17 July 2011.
- ^ a b c "Tories seize power in Southampton". BBC News Online. 2 May 2008. Retrieved 19 July 2011.
- ^ "Basingstoke & Deane". BBC News Online. Retrieved 17 July 2011.
- ^ Price, David Connop (25 January 2008). "Tories lose overall control of borough council". Basingstoke Gazette. Retrieved 19 July 2011.
- ^ a b c Price, David Connop (10 April 2008). "Every single seat on council up for grabs". Southern Daily Echo. Retrieved 19 July 2011.
- ^ a b c Price, David Connop (7 April 2008). "Independent makes switch to join Tories". Basingstoke Gazette. Retrieved 19 July 2011.
- ^ a b c Price, David Connop (2 May 2008). "Tory election triumph". Basingstoke Gazette. Retrieved 19 July 2011.
- ^ a b c d e f g h i j k l m n o p q r s t u v w x y z aa ab ac ad ae "Local Election of 1st May 2008". Basingstoke and Deane Borough Council. Retrieved 17 July 2011.
- ^ Price, David Connop (19 May 2008). "Cabinet appointments bring faces both familiar and new". Southern Daily Echo. Retrieved 19 July 2011.
- ^ Price, David Connop (8 May 2008). "Borough council leader set to go out on a high". Southern Daily Echo. Retrieved 19 July 2011.


 Council elections in Hampshire


